Service hotline
+86 0755-23615795

Release date:2021-12-28Author source:KinghelmViews:5664
Abstract
With the continuous development of mobile communication networks, operators possess high, medium, and low-frequency band resources. Radio frequency spectrum resources are valuable strategic resources, and how to use spectrum resources reasonably and efficiently is the primary concern for operators.
Currently, the 2.1 GHz and 3.5 GHz frequency bands are the mainstream frequency bands for deploying 5G networks. This article compares the coverage performance of the 2.1 GHz and 3.5 GHz bands from the perspectives of link budget and field testing, and provides a detailed analysis of their differences in coverage performance and service capacity. It also argues the drawbacks of independent deployment of 3.5 GHz frequency band and the efficiency improvement of subsequent network deployment by reusing the 2.1 GHz frequency band. Furthermore, it presents corresponding construction strategies based on the current situation of Shandong Unicom's existing network, providing important basis for the subsequent construction of 5G networks.
01 Overview
With the issuance of 5G licenses, the commercialization of China's 5G network has begun. The Ministry of Industry and Information Technology authorized China Unicom to use the 3.5 GHz frequency band for 5G. The 3.5 GHz frequency band has the best global industry support, but its high frequency leads to faster signal attenuation. Deploying 5G networks in the 3.5 GHz frequency band will require the addition of more base stations, leading to significantly higher investment in corresponding equipment and infrastructure. Building a high-quality and competitive 5G network at low cost has become an important issue facing China Unicom.
The initiative of China Unicom and China Telecom to jointly build and share 5G networks has brought opportunities to the construction of 5G networks. Currently, China Unicom's 3G network has a 15 MHz bandwidth in the 2.1 GHz frequency band, and its 4G network has a 10 MHz bandwidth in the 2.1 GHz frequency band. China Telecom's 4G network has a 20 MHz bandwidth in the 2.1 GHz frequency band. Together, China Unicom and China Telecom have a total bandwidth of 45 MHz in the 2.1 GHz frequency band, with an additional 10 MHz bandwidth remaining unallocated. If approved for use, China Unicom and China Telecom will have a total bandwidth of 55 MHz in the 2.1 GHz frequency band. The radio frequency spectrum resource is a valuable strategic resource, and the reasonable and efficient utilization of the 2.1 GHz and 3.5 GHz frequency bands in 5G networks is the primary concern for operators. This article combines link budget and field testing to compare and analyze the coverage performance and service capacity of the 2.1 GHz and 3.5 GHz frequency bands, demonstrating the drawbacks of independent deployment of the 3.5 GHz frequency band and the efficiency improvement of subsequent network deployment by reusing the 2.1 GHz frequency band. It also proposes corresponding construction strategies based on the current situation of Shandong Unicom's existing network, providing important basis for the subsequent construction of 5G networks.
02 Theoretical Analysis of Coverage Capability of 2.1 GHz and 3.5 GHz Frequency Bands
According to the 3GPP protocol, the B42 band corresponds to the 3.5 GHz frequency band, the B1 band corresponds to the 2.1 GHz frequency band, the B3 band corresponds to the 1.8 GHz frequency band, and the B41 band corresponds to the 2.6 GHz frequency band. The wavelength of the 3.5 GHz frequency band is shorter than that of the 2.1 GHz frequency band, resulting in poorer natural penetration, diffraction, and scattering capabilities compared to the 2.1 GHz frequency band, leading to insufficient uplink coverage on the terminal side.
Using the B3 band (1.8 GHz frequency band) in the existing network as the reference point, the theoretical link budget values for the 1.8 GHz, 3.5 GHz, 2.1 GHz, and 2.6 GHz frequency bands were calculated. A comparison of the uplink link budget results shows that the uplink capability of the 3.5 GHz frequency band is 7.7 dB worse than that of the 2.1 GHz frequency band (4T4R), and 4.2 dB worse than that of the 2.6 GHz frequency band.
Table 1 shows the uplink link budget results
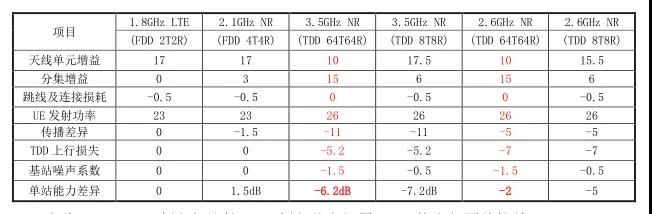
Based on the above analysis, it can be seen that the 3.5 GHz frequency band has poorer uplink coverage compared to the independent deployment of 5G networks in the 2.1 GHz frequency band.
03 Field Testing of Uplink Coverage Capability in the 2.1 GHz and 3.5 GHz Frequency Bands
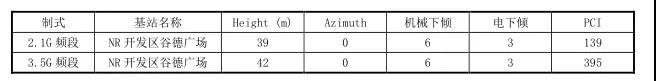
The GuDe Square base station in the Development Zone of Weifang City was selected for testing. Since there are currently no NR terminals supporting the 2.1 GHz frequency band, a field test was conducted by deploying 2.1 GHz 4T4R LTE equipment and 3.5 GHz 64TR NR equipment in the same station to compare the uplink coverage capabilities of the 3.5 GHz and 2.1 GHz frequency bands.
3.1 Test Parameter Settings
a) Deploying 2.1 GHz 4T4R LTE equipment and 3.5 GHz 64TR NR equipment in the same station, with the same height, azimuth, downtilt angle, and other parameters. During the test, surrounding base stations were temporarily shut down and transmit power was adjusted to expand the coverage range of the main measurement cell to over 500 meters.
Table 2 shows the physical parameters of the tested base station
b) The configuration of the 3.5 GHz base station is as follows: power configured at 200 W, SSB-RS parameter set at 17.8 dBm, NR downlink center carrier frequency at 3,550 MHz, with a bandwidth of 100 MHz, and a downlink to uplink slot ratio of 7:3. The SA terminal antenna configuration requires 2T4R, with a maximum transmission power of 26 dBm. The configuration of the 2.1 GHz base station is as follows: power configured as 4x40 W, CRS RS parameter set at 21.2 dBm, the SA terminal antenna configuration requires 1T4R, with a maximum transmission power of 23 dBm.
3.2 Test Description
The coverage of the 2.1 GHz and 3.5 GHz frequency bands was tested. A sector with the same main lobe direction, height, azimuth, downtilt angle (including electronic downtilt), and power spectral density in the 2.1 GHz and 3.5 GHz frequency bands was selected for testing. The following figures show the schematic diagram of the relevant CQT and DT test routes:
Schematic Diagram for Test Route in Figure 1
For the continuous outdoor blanket coverage area drive test (DT test), the requirements are as follows:
a) Place 2 terminals side by side on the car's desktop or seats, each locked to 3.5 and 2.1 GHz, respectively, initiate full-buffer FTP uplink services and maintain them.
b) The network management side should record real-time information such as the uplink noise floor of the main test cell during the test period.
c) The test vehicle carries test terminals and drive test tools to move slowly along the predetermined route (not exceeding 5 km/h), traversing roads within the main test cell, and the test duration should not be less than 1 hour.
d) If the service disconnects, record the disconnection information, reinitiate data services nearby, and continue the drive test.
e) The drive test software should record LOG data in real time according to requirements throughout the entire test process.
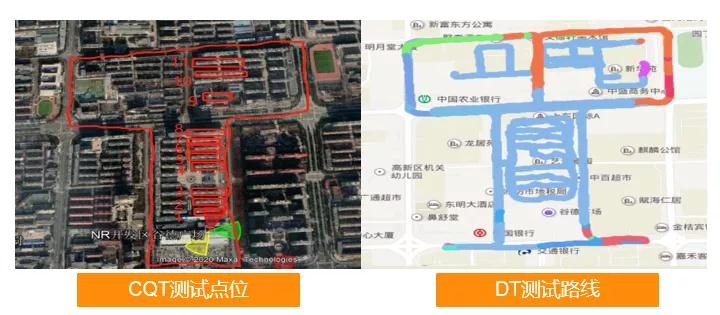
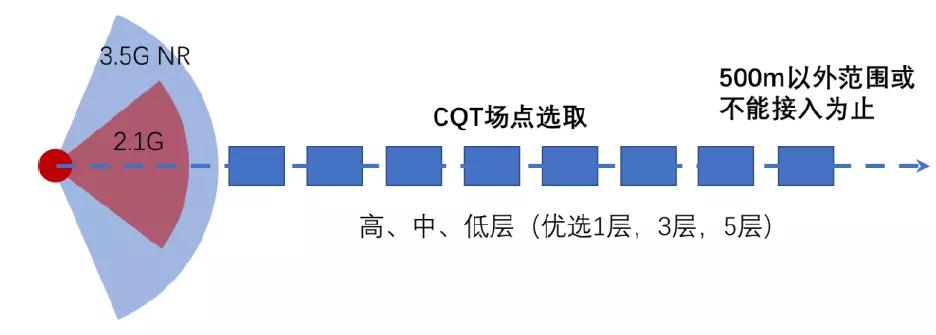
When conducting deep coverage CQT testing, select no fewer than 7 buildings in the near-to-far direction from the main lobe normal direction of the 3.5G and 2.1G cells as CQT test buildings, until the buildings are 500 meters away from the base station or cannot be accessed, as shown in Figure 2.
Selection of CQT Test Points in Figure 2
a) For each building to be tested, high, medium, and low floors are selected for testing, with a preference for testing on the 1st, 3rd, and 5th floors.
b) Place 2 terminals side by side, lock them to 3.5 GHz and 2.1 GHz respectively, initiate full-buffer FTP uplink services at each testing point within the buildings, traverse the indoor paths, and maintain the service for at least 1 minute. If it is not possible to complete access within the testing building, detailed test phenomena should be recorded.
c) Maintain the same antenna height and downtilt angle, rotate the two main test cells clockwise by 30 degrees (adjust adjacent cells as needed), and repeat step (b) at the original test position along the same test route.
3.3 Coverage Capability CQT Test
The comparative results of the uplink coverage CQT test for single cells at 2.1G and 3.5G are shown in Figure 3.
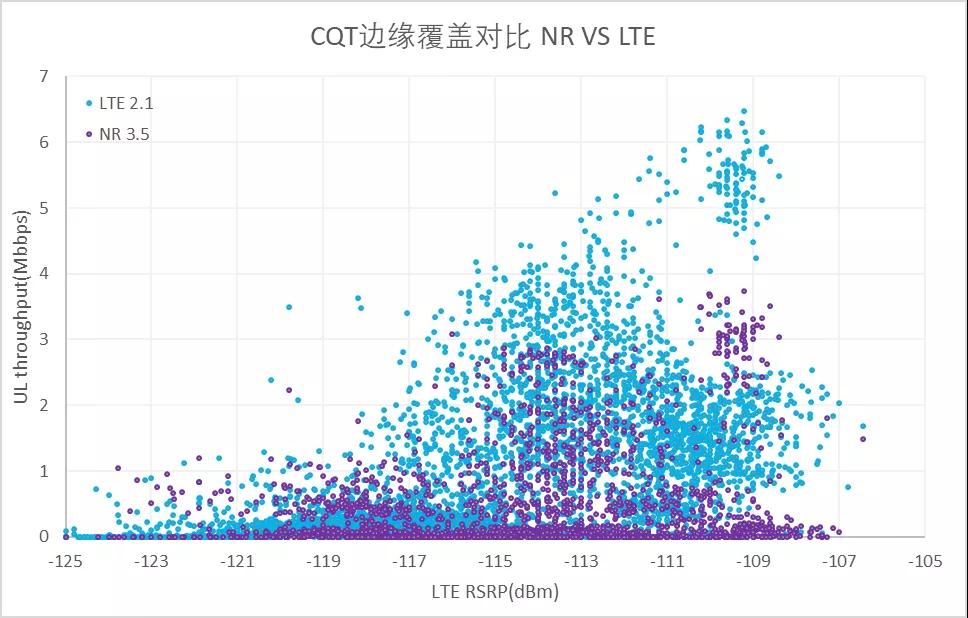
The CQT Test Results in Figure 3
According to the test results in Figure 3, it is evident that under the condition of cell edge coverage (LTE RSRP<-105 dBm), the approximate coverage probability for the 2.1G band is 94%, while for the 3.5G band, it is 31%. In the case of deep coverage testing, the RSRP value for the 3.5G band is 6-7 dB lower than the 2.1G band, indicating that the performance of the 3.5G band is inferior to the 2.1G band in terms of deep coverage.
3.4 Coverage Capability DT Test
In the analysis of the DT test data, LTE 2.1G mobile phones and NR 3.5G mobile phones are positioned at the same location and simultaneously conduct blanket coverage tests within the cell. For the purpose of comparative analysis, the LTE and NR rates at the same location are normalized according to LTE RSRP.
For the actual road coverage testing of the 2.1G and 3.5G frequency bands in the existing network, sectors with the same main lobe normal direction, mounting height, azimuth, downtilt angle (including electrical downtilt), and power spectral density are selected for both the 2.1G and 3.5G frequency bands. The DT test trajectory results are shown in Figure 4.
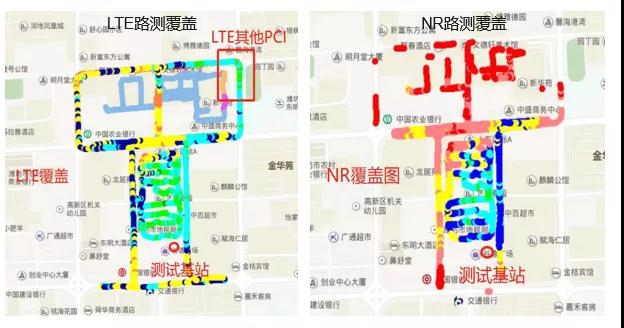
Figure 4: Coverage Situation Map for 4DT Testing
Based on the road test data RSRP comparative analysis, the average signal strength for the 2.1G frequency band testing is -97 dBm, while for the 3.5G frequency band testing, it is -105 dBm. Additionally, there is a severe issue of areas experiencing network outage during the 3.5G frequency band testing.
As the coverage distance increases, in non-line-of-sight scenarios, the signal attenuation for 3.5G is greater than that for 2.1G. Furthermore, the difference in signal strength between the two bands continues to increase with the expansion of coverage distance. The data analysis is depicted in Figure 5.
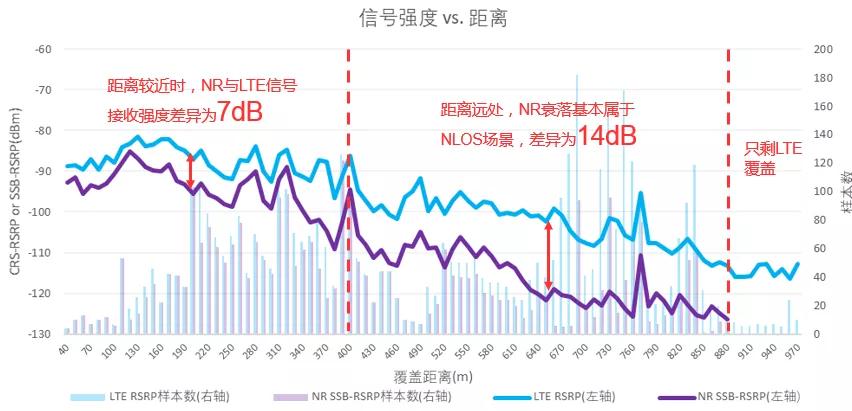
The comparative analysis of the signal strength and coverage distance for 5DT testing is shown in Figure 5
According to the analysis of the data in Figure 5, it can be observed that when the coverage distance is relatively close, the signal reception strength of 3.5G in line-of-sight scenarios differs from 2.1G by approximately 7 dB. However, at greater coverage distances, in non-line-of-sight scenarios, the signal strength difference between the two is approximately 14 dB.
Furthermore, an analysis of the coverage situation for 3.5G and 2.1G at the cell edge is depicted in Figure 6.
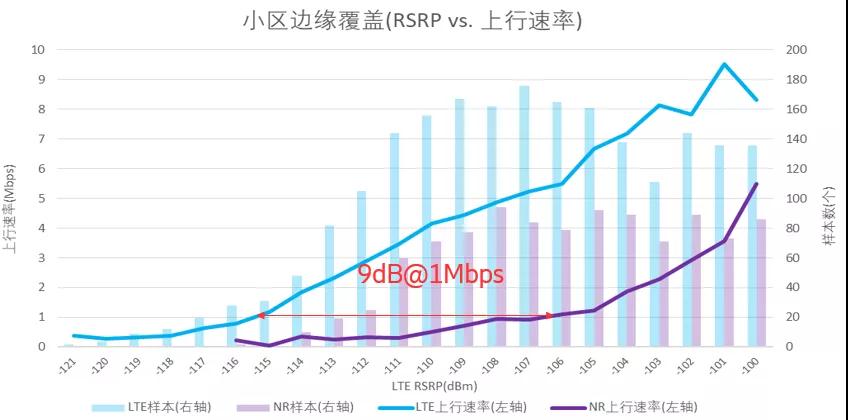
The analysis of Figure 6 reveals that at a speed of 1 Mbit/s at the cell edge, the received signal for 2.1G is -115 dBm, while for 3.5G it is -106 dBm. Hence, the coverage difference between LTE 2.1G and NR 3.5G in the actual network environment is 9 dB.
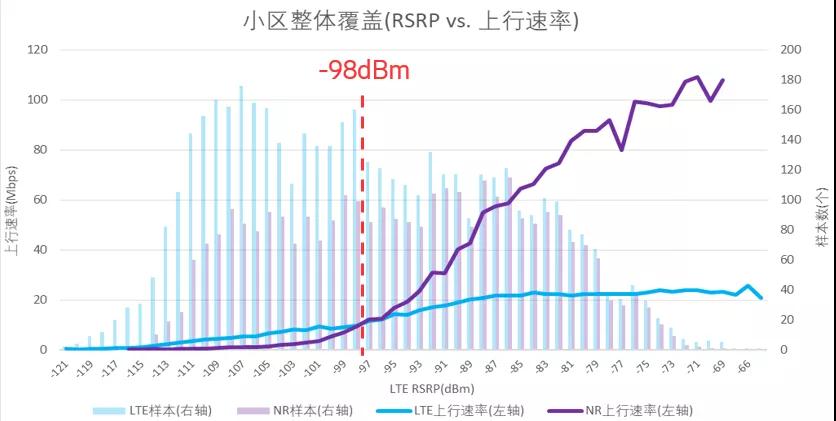
A comparative analysis of the uplink rates shows that when the signal strength is -98 dBm, the uplink rate for 3.5G NR is significantly higher than that of the 2.1G frequency band.
Comparison Analysis of Upstream Rate for 7DT Testing in Small Cell and 4T4R 2.1G NR Voice Support Capability
04 Analysis of Voice Support Capability for 4T4R 2.1G NR
As the principle of co-building and sharing between China Unicom and China Telecom is established, voice carrying solutions are gradually evolving towards VoNR. During the NSA networking phase, voice can be flexibly allocated to the LTE networks of China Unicom or China Telecom through VoLTE. During the SA networking phase, it can initially fall back to the LTE network through EPS and subsequently smoothly activate the VoNR function in the 2.1G frequency band.
By comparing the voice carrying of VoLTE and WCDMA networks and analyzing MOS values and RSRP data, it can be observed that the voice quality of VoNR in the 2.1G frequency band is stronger than that of the WCDMA network.
05 Recommendations for the Application of 2.1G and 3.5G
Based on the previous analysis, it is clear that the 2.1G frequency band can effectively enhance the capacity and coverage of the 3.5G frequency band. However, the bandwidth of the 2.1G frequency band is not as abundant as that of the 3.5G frequency band, and the 3.5G NR device industry chain is relatively mature. After comprehensive analysis, the following conclusions and recommendations can be drawn for the application of the 2.1G and 3.5G frequency bands:
a) Due to the immaturity of the 2.1G NR device industry chain, it is recommended to use the 3.5G network as the foundation for initial construction of the 5G network to achieve continuous coverage. Subsequently, efforts should be made to accelerate the reduction and elimination of 2G and 3G networks, and timely re-cultivate the 2.1G frequency band to create a differentiated 5G network with coordinated high and low frequencies.
b) The hybrid networking of the 2.1G and 3.5G frequency bands is an important approach for building high-quality 5G networks. The 2.1G frequency band can provide supplementary uplink capacity and extended deep coverage. By flexibly networking according to construction needs, user perception can be improved, and the brand influence of China Unicom can be enhanced.
c) The mixed-mode networking of 3G/4G/5G can utilize software upgrades of existing network equipment to enable 5G services, thereby reducing the cost of constructing the 5G network and maximizing the utilization of existing network equipment capabilities. It also provides a prerequisite for subsequent network structure adjustments.
06 Conclusion
This article has conducted a comparative analysis of the coverage performance of the 2.1G and 3.5G frequency bands from the perspectives of link budget and on-site testing. It was found that the signal attenuation in the 3.5G frequency band is greater, and in terms of deep coverage, the performance of the 3.5G frequency band is inferior to that of the 2.1G frequency band. At the same edge rate, the uplink coverage of the 3.5G frequency band is 9 dB worse than that of the 2.1G frequency band. Through theoretical analysis and on-site testing, it was discovered that the 2.1G frequency band can effectively enhance the capacity and coverage range of the 3.5G frequency band. The hybrid networking of the 2.1G and 3.5G frequency bands for 5G networks can enhance the uplink coverage capability, thereby meeting the uplink capacity and latency requirements of 5G industry applications. Re-cultivating the existing 2.1G frequency band and equipment to support 5G can expedite the construction of 5G networks, reduce construction resource inputs, and lower construction difficulty, thus serving as an important means to improve the efficiency of 5G network construction.
This article is reprinted from "5G New Technology." We support the protection of intellectual property rights. Please indicate the original source and author when reprinting. If there is any infringement, please contact us for deletion.